In the realm of data analysis and reporting, effective time-based analysis is essential for gaining valuable insights. Power BI, a powerful business intelligence tool, offers a range of features to handle time-related data. One of the best practices for optimizing time intelligence in Power BI is utilizing a central date table. In this blog post, we will explore five compelling reasons why incorporating a central date table into your Power BI workflow can revolutionize your data analysis and reporting.
Simplified Date Hierarchies
Creating consistent and intuitive date hierarchies across multiple data sources can be challenging. With a central date table, you can streamline the process by connecting all relevant tables to a single date table. This ensures uniformity in date calculations and provides a structured hierarchy, allowing easy drill-down capabilities from year to month, day, or even hour. By establishing a central point for all your date-related information, you eliminate inconsistencies and make your analysis more efficient.
Efficient Filtering and Slicing
Imagine the ability to filter and slice your data effortlessly by various time periods, such as specific dates, months, quarters, or years. By connecting your fact tables to a central date table, you can leverage its relationships to perform powerful time-based analysis. This enables you to explore trends, compare data between different periods, and gain deeper insights into your business metrics. With a central date table, the process of filtering and slicing becomes seamless, saving you time and effort.
Enhanced Time Intelligence
Power BI offers a robust set of time intelligence functions that allow you to perform advanced calculations based on dates. However, implementing these calculations across multiple tables can be complex and time-consuming. A central date table simplifies the process by acting as a single source of truth for all time-related calculations. Whether you need to calculate year-to-date totals, rolling averages, or identify year-over-year changes, having a centralized date table streamlines the implementation of these functions, enabling you to focus on analysis rather than intricate calculations.
Customized Fiscal Calendars
Many organizations follow non-standard fiscal calendars, which can pose challenges when generating reports and analyzing data. A central date table provides the flexibility to create customized fiscal calendars tailored to your organization’s specific requirements. You can define the start and end dates of fiscal years, quarters, or months, aligning your reports and calculations seamlessly with your fiscal periods. This feature ensures accuracy and consistency in reporting, particularly for financial analysis and planning.
Improved Performance
Efficient data retrieval and report rendering are critical for a seamless user experience. Utilizing a central date table can significantly improve the performance of your Power BI reports. By connecting all relevant tables to a single date table, you minimize the number of relationships and calculations required. This optimization leads to faster query execution and report generation. Ultimately, improved performance translates into more productive analysis and enables you to make data-driven decisions in real-time.
Examples
let
    // Generate a list of dates for your central date table
    StartDate = #date(2020, 1, 1),
    EndDate = #date(2023, 12, 31),
    NumberOfDays = Duration.Days(EndDate - StartDate),
    DatesList = List.Dates(StartDate, NumberOfDays + 1, #duration(1, 0, 0, 0)),
    Source = List.Transform(DatesList, each {_, Date.Year(_), Date.Month(_), Date.Day(_)})
in
    // Create the central date table
    #table(
        {"Date", "Year", "Month", "Day"},
        Source
    )
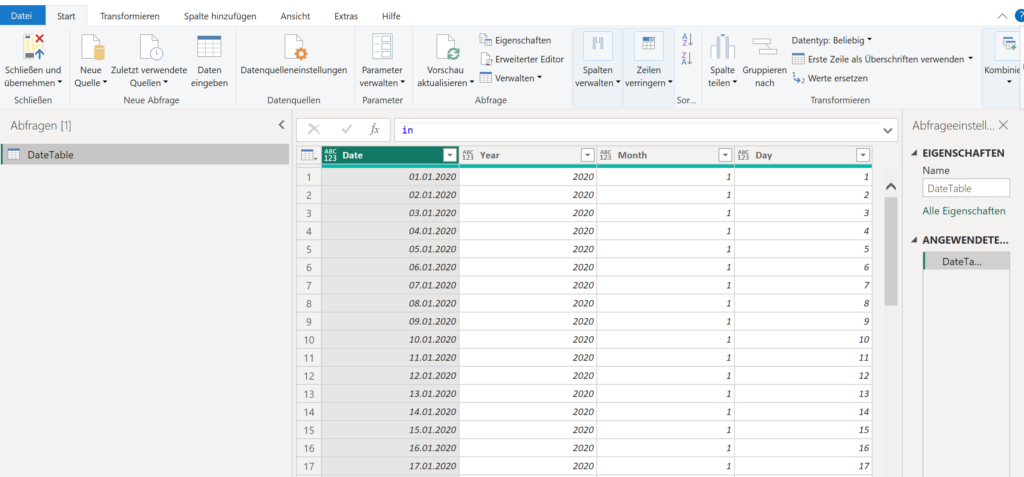
In this example, we start by defining the start and end dates for your central date table using the StartDate and EndDate variables. Next, we calculate the number of days between the start and end dates using the Duration.Days function. Then, we generate a list of dates using the List.Dates function, specifying the start date, the number of days, and the duration between each date.
We transform the list of dates into a table format by using the List.Transform function. Each date in the list is transformed into a row with four columns: the date itself, the year, the month, and the day.
Finally, we create the central date table using the #table function, providing the column names as the first argument and the transformed source as the second argument.
You can customize this example to fit your specific requirements, such as adjusting the start and end dates or adding additional columns to the central date table. Once created, you can load this central date table into Power BI and establish relationships with other tables to leverage its benefits in time-based analysis and reporting.
Comprehensive Example
A good implementation can be found here https://gist.github.com/bi-luxstay/d49c66dd648f43db22d39fdc1e7ffaa5
let
    // configurations start
    Today=Date.From(DateTime.LocalNow()), // today's date
    FromYear = 2015, // set the start year of the date dimension. dates start from 1st of January of this year
    ToYear=Date.Year(Today), // set the end year of the date dimension. dates end at 31st of December of this year
    StartofFiscalYear=7, // set the month number that is start of the financial year. example; if fiscal year start is July, value is 7
    firstDayofWeek=Day.Monday, // set the week's start day, values: Day.Monday, Day, Sunday....
    // configuration end
    FromDate=#date(FromYear,1,1),
    ToDate=Today,
    Source=List.Dates(
        FromDate,
        Duration.Days(ToDate-FromDate)+1,
        #duration(1,0,0,0)
    ),
    #"Converted to Table" = Table.FromList(Source, Splitter.SplitByNothing(), null, null, ExtraValues.Error),
    #"Renamed Columns" = Table.RenameColumns(#"Converted to Table",{{"Column1", "Date"}}),
    #"Changed Type" = Table.TransformColumnTypes(#"Renamed Columns",{{"Date", type date}}),
    #"Inserted Year" = Table.AddColumn(#"Changed Type", "Year", each Date.Year([Date]), Int64.Type),
    #"Inserted Start of Year" = Table.AddColumn(#"Inserted Year", "Start of Year", each Date.StartOfYear([Date]), type date),
    #"Inserted End of Year" = Table.AddColumn(#"Inserted Start of Year", "End of Year", each Date.EndOfYear([Date]), type date),
    #"Inserted Month" = Table.AddColumn(#"Inserted End of Year", "Month", each Date.Month([Date]), Int64.Type),
    #"Inserted Start of Month" = Table.AddColumn(#"Inserted Month", "Start of Month", each Date.StartOfMonth([Date]), type date),
    #"Inserted End of Month" = Table.AddColumn(#"Inserted Start of Month", "End of Month", each Date.EndOfMonth([Date]), type date),
    #"Inserted Days in Month" = Table.AddColumn(#"Inserted End of Month", "Days in Month", each Date.DaysInMonth([Date]), Int64.Type),
    #"Inserted Day" = Table.AddColumn(#"Inserted Days in Month", "Day", each Date.Day([Date]), Int64.Type),
    #"Inserted Day Name" = Table.AddColumn(#"Inserted Day", "Day Name", each Date.DayOfWeekName([Date]), type text),
    #"Inserted Day of Week" = Table.AddColumn(#"Inserted Day Name", "Day of Week", each Date.DayOfWeek([Date]), Int64.Type),
    #"Inserted Day of Year" = Table.AddColumn(#"Inserted Day of Week", "Day of Year", each Date.DayOfYear([Date]), Int64.Type),
    #"Inserted Month Name" = Table.AddColumn(#"Inserted Day of Year", "Month Name", each Date.MonthName([Date]), type text),
    #"Inserted Quarter" = Table.AddColumn(#"Inserted Month Name", "Quarter", each Date.QuarterOfYear([Date]), Int64.Type),
    #"Inserted Start of Quarter" = Table.AddColumn(#"Inserted Quarter", "Start of Quarter", each Date.StartOfQuarter([Date]), type date),
    #"Inserted End of Quarter" = Table.AddColumn(#"Inserted Start of Quarter", "End of Quarter", each Date.EndOfQuarter([Date]), type date),
    #"Inserted Week of Year" = Table.AddColumn(#"Inserted End of Quarter", "Week of Year", each Date.WeekOfYear([Date],firstDayofWeek), Int64.Type),
    #"Inserted Week of Month" = Table.AddColumn(#"Inserted Week of Year", "Week of Month", each Date.WeekOfMonth([Date],firstDayofWeek), Int64.Type),
    #"Inserted Start of Week" = Table.AddColumn(#"Inserted Week of Month", "Start of Week", each Date.StartOfWeek([Date],firstDayofWeek), type date),
    #"Inserted End of Week" = Table.AddColumn(#"Inserted Start of Week", "End of Week", each Date.EndOfWeek([Date],firstDayofWeek), type date),
    FiscalMonthBaseIndex=13-StartofFiscalYear,
    adjustedFiscalMonthBaseIndex=if(FiscalMonthBaseIndex>=12 or FiscalMonthBaseIndex<0) then 0 else FiscalMonthBaseIndex,
    #"Added Custom" = Table.AddColumn(#"Inserted End of Week", "FiscalBaseDate", each Date.AddMonths([Date],adjustedFiscalMonthBaseIndex)),
    #"Changed Type1" = Table.TransformColumnTypes(#"Added Custom",{{"FiscalBaseDate", type date}}),
    #"Inserted Year1" = Table.AddColumn(#"Changed Type1", "Year.1", each Date.Year([FiscalBaseDate]), Int64.Type),
    #"Renamed Columns1" = Table.RenameColumns(#"Inserted Year1",{{"Year.1", "Fiscal Year"}}),
    #"Inserted Quarter1" = Table.AddColumn(#"Renamed Columns1", "Quarter.1", each Date.QuarterOfYear([FiscalBaseDate]), Int64.Type),
    #"Renamed Columns2" = Table.RenameColumns(#"Inserted Quarter1",{{"Quarter.1", "Fiscal Quarter"}}),
    #"Inserted Month1" = Table.AddColumn(#"Renamed Columns2", "Month.1", each Date.Month([FiscalBaseDate]), Int64.Type),
    #"Renamed Columns3" = Table.RenameColumns(#"Inserted Month1",{{"Month.1", "Fiscal Month"}}),
    #"Removed Columns" = Table.RemoveColumns(#"Renamed Columns3",{"FiscalBaseDate"}),
    #"Inserted Age" = Table.AddColumn(#"Removed Columns", "Age", each [Date]-Today, type duration),
    #"Extracted Days" = Table.TransformColumns(#"Inserted Age",{{"Age", Duration.Days, Int64.Type}}),
    #"Renamed Columns4" = Table.RenameColumns(#"Extracted Days",{{"Age", "Day Offset"}}),
    #"Added Custom1" = Table.AddColumn(#"Renamed Columns4", "Month Offset", each (([Year]-Date.Year(Today))*12)
+([Month]-Date.Month(Today))),
    #"Changed Type2" = Table.TransformColumnTypes(#"Added Custom1",{{"Month Offset", Int64.Type}}),
    #"Added Custom2" = Table.AddColumn(#"Changed Type2", "Year Offset", each [Year]-Date.Year(Today)),
    #"Changed Type3" = Table.TransformColumnTypes(#"Added Custom2",{{"Year Offset", Int64.Type}}),
    #"Added Custom3" = Table.AddColumn(#"Changed Type3", "Quarter Offset", each (([Year]-Date.Year(Today))*4)
+([Quarter]-Date.QuarterOfYear(Today))),
    #"Changed Type4" = Table.TransformColumnTypes(#"Added Custom3",{{"Quarter Offset", Int64.Type}}),
    #"Added Custom4" = Table.AddColumn(#"Changed Type4", "Year month", each [Year]*100 + [Month]),
    #"Changed Type5" = Table.TransformColumnTypes(#"Added Custom4",{{"Year month", Int64.Type}}),
    #"Added Custom5" = Table.AddColumn(#"Changed Type5", "Year week", each [Year]*100 + [Week of Year]),
    #"Added Custom6" = Table.AddColumn(#"Added Custom5", "Year-month", each Text.Combine({Number.ToText([Year]), "-", if [Month] < 10 then "0" else "", Number.ToText([Month])})),
    #"Added Custom7" = Table.AddColumn(#"Added Custom6", "Year-week", each Text.Combine({Number.ToText([Year]), "-", if [Week of Year] < 10 then "0" else "", Number.ToText([Week of Year])})),
    #"Added Custom8" = Table.AddColumn(#"Added Custom7", "Week offset", each ([Year] - Date.Year(Today))*52
 + [Week of Year] - Date.WeekOfYear(Today,firstDayofWeek)),
    #"Changed Type6" = Table.TransformColumnTypes(#"Added Custom8",{{"Week offset", Int64.Type}, {"Year-week", type text}, {"Year-month", type text}, {"Year week", Int64.Type}}),
    #"Added Custom9" = Table.AddColumn(#"Changed Type6", "Half year", each if [Month] <= 6 then 1 else 2),
    #"Added Custom10" = Table.AddColumn(#"Added Custom9", "Year-half year", each Text.Combine({Number.ToText([Year]), "-", Number.ToText([Half year])})),
    #"Added Custom11" = Table.AddColumn(#"Added Custom10", "Year half year", each [Year]*10 + [Half year]),
    #"Changed Type7" = Table.TransformColumnTypes(#"Added Custom11",{{"Year half year", Int64.Type}})
in
    #"Changed Type7"
With this Code, you will be able to get fiscal years, half years, weeks etc.
Conclusion
Incorporating a central date table into your Power BI workflow can revolutionize your data analysis and reporting capabilities. From simplified date hierarchies and efficient filtering to enhanced time intelligence and customized fiscal calendars, the benefits are abundant. Moreover, the improved performance empowers you to analyze and visualize your data with speed and accuracy. By adopting this best practice, you will unlock the full potential of Power BI and take your data analysis to new heights, driving informed decision-making and achieving business success.