Power BI is a powerful tool for data analysis and visualization. When working with large datasets, it’s common to encounter missing data, which can affect the accuracy of insights and visualizations. In this blog post, we will explore how to create a Power BI measure to remove rows with missing data from a table, ensuring cleaner and more reliable data for analysis.
The Goal
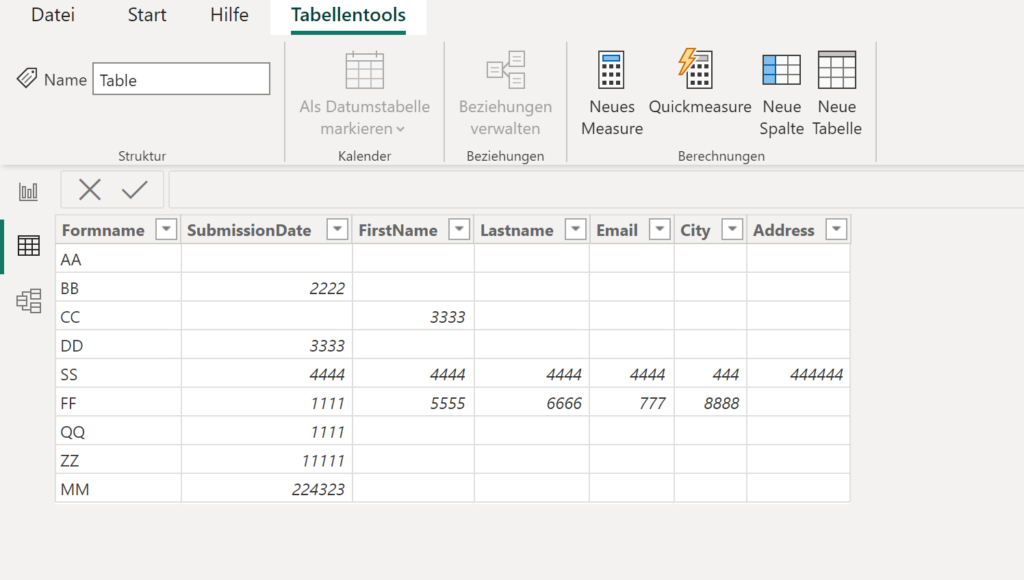
Your objective is to eliminate rows that contain missing values in any of these fields, as they can introduce inaccuracies or distort your analysis. We will guide you through the process of creating a Power BI measure that accomplishes this task.
A sample table could look like this:
The Measure
To remove rows with missing data, we will use a calculated column with an IF statement that checks for blank values in each field. Follow the steps below:
Step 1: Open Power BI Desktop and navigate to the Data view.
Step 2: Locate the table containing the data you want to clean and ensure it is selected.
Step 3: In the Modeling tab, click on “New Measure” to create a new measure.
Step 4: Provide a meaningful name for your measure, such as “FilteredRows”.
Step 5: Enter the following formula for the measure:
FilteredRows =
IF(
    ISBLANK(MAX('Table'[SubmissionDate])) ||
    ISBLANK(MAX('Table'[FirstName])) ||
    ISBLANK(MAX('Table'[LastName])) ||
    ISBLANK(MAX('Table'[Email])) ||
    ISBLANK(MAX('Table'[City])) ||
    ISBLANK(MAX('Table'[Address])),
    BLANK(),
    1
)
Step 6: Click on the checkmark icon to apply the measure.
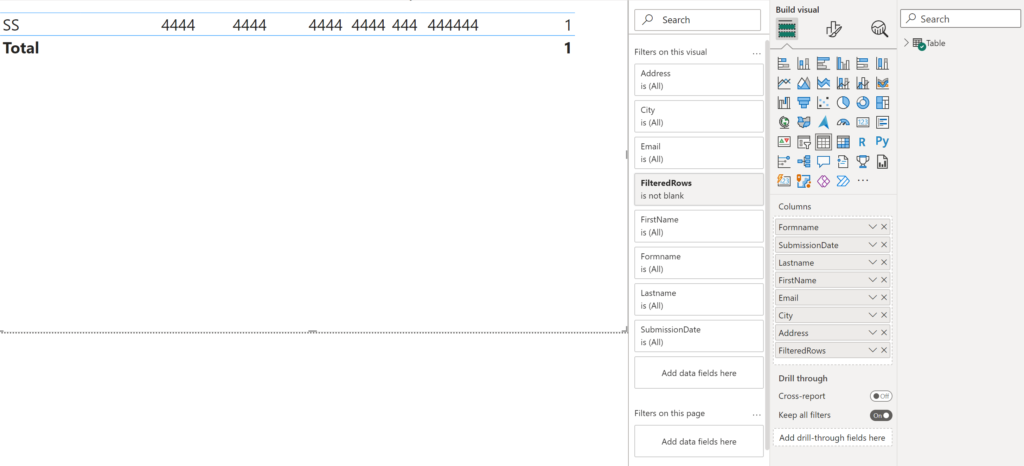
The measure we created uses the IF statement to check if any of the fields contain blank values using the ISBLANK and MAX functions. If any of the fields are blank, the measure returns BLANK(), indicating that the row should be filtered out. Otherwise, it returns a value of 1, indicating that the row should be included in the analysis.
The final result looks like this:
Conclusion
In this blog post, we explored how to create a Power BI measure to remove rows with missing data from a table. By using an IF statement and checking for blank values in each field, we were able to effectively filter out the rows that could introduce inaccuracies or distort our analysis. This approach ensures cleaner and more reliable data for visualization and insights.
Cleaning and preparing data is an essential step in the data analysis process, and Power BI provides powerful tools like measures to help us achieve this. By utilizing measures creatively, you can streamline your data cleaning tasks and enhance the accuracy and reliability of your Power BI reports and dashboards.