
In today’s data-driven world, extracting meaningful insights from various sources is key to making informed decisions. If you’re a Netflix enthusiast looking to analyze your viewing patterns and gain valuable insights, this tutorial will guide you through the process of converting your Netflix view data into visually appealing Power BI reports. By leveraging the power of Power BI and enriching your view data with metadata from OMDB, you can uncover fascinating details about your viewing habits. So, let’s dive in!
Download the View History from Netflix
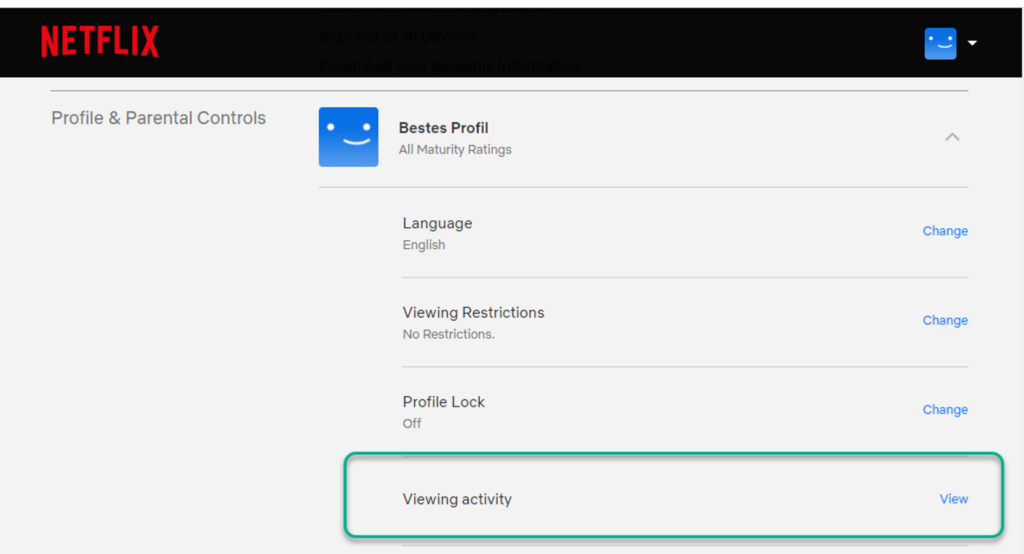
To get started, log in to your Netflix profile and locate the option to download your view history.
https://www.netflix.com/youraccount
This feature allows you to obtain a file containing all the information about the movies and series you’ve watched, including dates, titles, and other relevant details. Download the view history file to your local machine.

Import the Data into Power BI Desktop
Open Power BI Desktop, create a new report, and import the downloaded view history file. Power BI provides various connectors to import data from different sources, including files. Use the appropriate connector to access and load your Netflix view data into Power BI.

Enrich the Titles with OMDB API
To enhance the analysis of your Netflix view data, you can enrich the movie and series titles by pulling additional metadata from the Open Movie Database (OMDB) using its API. Obtain an API key from OMDB, and within Power BI Desktop, establish a connection to the OMDB API by entering your API key. Utilize the OMDB API to fetch metadata such as release year, genre, cast, and ratings for each title in your view data. This enriched information will add depth and context to your reports.
Free API Keys (1000/day)
Create a Stunning Power BI Report
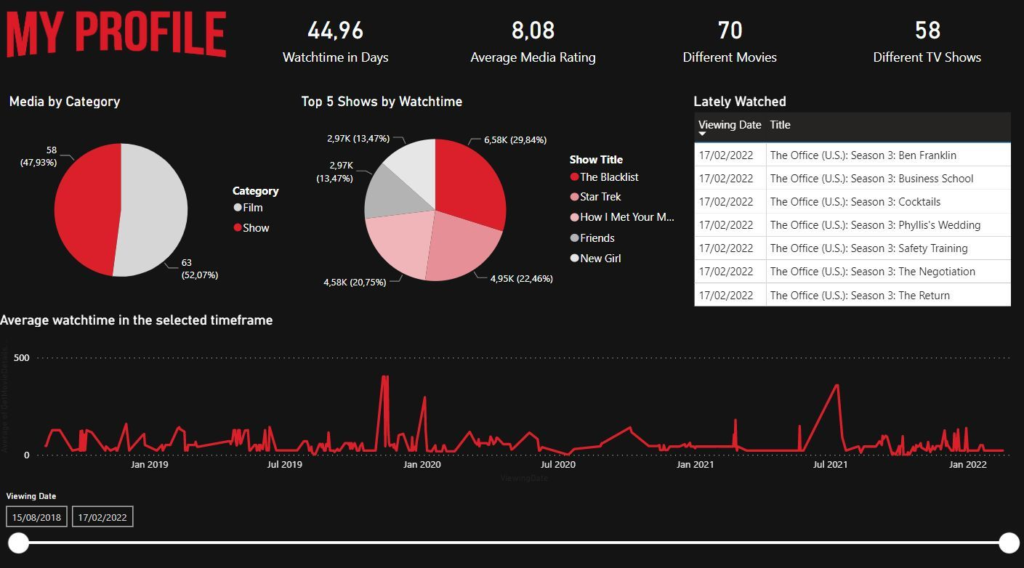
With your Netflix view data and enriched metadata ready, it’s time to unleash your creativity and build visually appealing Power BI reports. Utilize the wide range of data visualization options provided by Power BI to create meaningful charts, graphs, and interactive dashboards that highlight key insights. Group your view data by different criteria like genres, release years, or binge-watching trends to uncover interesting patterns and preferences. Remember, aesthetics matter too! Design your report with a user-friendly interface, captivating colors, and intuitive navigation to make the viewing experience delightful.
Conclusion
By following these steps, you can seamlessly convert your Netflix view data into insightful Power BI reports. The combination of your viewing history, enriched metadata, and powerful visualizations will empower you to gain valuable insights into your preferences, discover trends, and even explore new genres or shows you may have overlooked. So, download your Netflix view history, fire up Power BI Desktop, and unlock a whole new world of analytics for your Netflix addiction. Happy reporting!
Remember, the eye eats with you after all!